Semantic Layer Guide 2025: Strategy, Tools & Implementation
.png)
.png)
Table of Contents

TL; DR
- You don’t have a data problem. You have a “which number is right?” problem. A semantic layer fixes it. Define business logic once, expose it everywhere, and make dashboards, spreadsheets, and AI agents agree
- Expect faster self-service, fewer reconciliations, and audit-ready governance with row and column controls
- Marketing, finance, and product align on definitions like conversion, revenue, DAU, and retention so decisions move faster
- Compare tools realistically: AtScale (enterprise), dbt Semantic Layer (code-first), Cube (open-source headless), 5X (open-source foundation inside a full platform)
You don’t have a data problem. You have a “which number is right?” problem.
Sales, finance, and product walk into the exec review with three versions of revenue. You end up spending half the meeting reconciling definitions instead of making decisions.
Dashboards disagree. Spreadsheets multiply. And your AI happily hallucinates on top of it all. As a result, roughly 50% of leaders say they don’t fully trust their data for decision-making.
That’s why you need a semantic layer. Define business logic once. Expose it everywhere. Make every dashboard, spreadsheet, and AI agent speak the same language.
In this post, we’ll show you what a semantic layer is, how it plugs into your stack, which tools matter, and how to implement without breaking the plane mid-flight.
What is a semantic layer?
A semantic layer is a business representation of data. It’s an abstraction layer that takes the raw data from databases (with all their cryptic table names and schemas) and presents it in familiar business terms.
Instead of forcing users to write SQL or interpret technical fields, the semantic layer provides a common vocabulary. For example, it ensures that “customer_count” in a table is exposed as “Active Customers” with a defined business logic.
Key features of a semantic layer:

- Central metric definitions: Core KPIs such as Revenue, Churn, LTV, and Margin are defined once, stored as code or metadata, and reused across all reports to maintain consistency
- Business-friendly terms: Converts technical field names into plain language with clear hierarchies (for example, Product → Category → Department) so business users can explore data accurately
- Governance and security: Enforces access controls like row-level security, tracks data lineage, and ensures users only see trusted, approved information
- Abstracted data access: Hides the complexity of multiple data sources like Snowflake or BigQuery, joins data virtually, and generates queries automatically for a unified view
Why is a semantic layer critical in the age of AI and large language models (LLMs)?
Because AI is only as effective as the context it understands. Generative AI can answer questions in plain English, but without knowing what terms like “Customer Churn Rate” or “Gross Margin” mean in your business, it’s operating blind. A semantic layer gives AI that context.
It defines business logic, relationships, and metrics, essentially teaching the model how your data connects to your operations. By grounding AI on the semantic layer, companies improve the accuracy and reliability of AI-generated insights.
Better AI isn't about more data; it is about the quality of data and its connectivity. We have assigned accountability to make sure that we just don't keep on saying the quality is bad, but keep improving it.
~ Anindita Misra, Global Director of Knowledge Activation & Trust, Decathlon Digital
How Decathlon uses data to optimize in-store operations
How we built secure, conversational BI (and why)
Dashboards are great for high-level metrics but they often fall short when you need deeper, contextual insights. That’s why we built Conversational BI, powered by 5X’s semantic layer, enabling anyone to query data securely in natural language.
It complements dashboards by providing instant, nuanced answers—no SQL or analyst bottlenecks. Designed to live within your stack (not someone else’s cloud), it brings speed, governance, and clarity to decision-making.
👉 Read the full story to see how 5X built secure, conversational BI—and what’s coming next.
How does a semantic layer work in the modern data stack?

In a modern data stack, the semantic layer typically sits on top of your data warehouse or lake and feeds into your analytics and AI tools. Think of it as the middle layer in a 3-tier model:
Data sources (bottom) → Semantic layer (middle) → Consumption tools (top)
- At the bottom, you have your raw data storage: data warehouses (Snowflake, BigQuery, Redshift, etc.), data lakes, operational databases, etc. This is where data is stored and transformed into clean tables.
- At the top, you have your consumption and analytics tools: BI platforms (Tableau, Power BI, Looker, Superset), analytics notebooks, dashboards, as well as ML/AI applications and now LLMs.
- In the middle is the semantic layer, acting as a translation and control layer. It connects to the data sources on one side and to the BI/AI tools on the other side.
Here’s a deeper walkthrough of how it works and why each step matters.
1. Connect to your data sources
The semantic layer starts by connecting to your existing data infrastructure: cloud warehouses like Snowflake, BigQuery, or Redshift, as well as data lakes and operational systems. It does not require moving all your data. Instead, it reads schemas, understands where data lives, and maps those connections.
Without this connectivity, your logic layer is blind. The semantic layer’s primary role is “converting raw data into business-meaningful information” and creating “a unified business view of data across the organisation” regardless of where it lives.
Also read: 7 Best Data Ingestion Tools for Business Success in 2025
2. Define your business logic centrally
Once connected, the semantic layer becomes your logic hub. Here, you and your analytics/data engineering team define what key terms and metrics mean—“active customer”, “net revenue”, “churn rate”, etc. These definitions include formulas, business rules, time logic, filters, hierarchies.
For example:
- Active customer = customer with ≥1 purchase in the last 90 days
- Net revenue = gross revenue minus refunds and discounts
3. Map business logic to physical data
Next, the layer ties your business definitions to actual tables and fields: which table holds the order data, which columns represent status, how to join customers to transactions. The semantic layer handles the mapping of business concepts to your data structures and relationships.
Analysts no longer need to know that “tbl_order_detail” plus “cust_master” equals “orders by customer”. The semantic layer hides that complexity and gives them a clean business view.
4. Expose a single access point for all tools
Once definitions and mappings are complete, the semantic layer presents one governed interface such as a SQL endpoint, REST or GraphQL API, ODBC or JDBC connection, or BI connector. All downstream tools (dashboards, spreadsheets, AI agents) pull from this interface rather than each tool reinventing definitions.
With multiple BI tools and analytics systems in use, each with their own version of metrics, chaos emerges. A universal interface ensures consistency. A universal semantic layer enables users to work within their preferred analytics tools without sacrificing consistency or speed
5. Translate and optimize queries in real time
When a user or tool requests a metric such as “total revenue by region Q4,” the semantic layer intercepts the request, applies business logic, injects the correct joins, filters, and security rules, then converts it into optimized SQL or another query language for your warehouse. Many layers also use caching and pre-aggregation to boost performance.
As data volume grows, unoptimized queries slow systems down. The semantic layer standardizes both the logic and the query path, improving speed and reliability.
Where the semantic layer lives in the modern stack
A semantic layer can be deployed in different parts of the data architecture depending on your strategy and tools. It can live inside the data warehouse, operate as a standalone service, or be embedded within a BI platform. Each approach comes with trade-offs in flexibility, scalability, and governance.
1. Warehouse-native semantic layer
In this setup, the semantic logic is built directly inside the data warehouse. Metrics are defined as SQL views, materialized views, or through native modeling features. This keeps logic close to the data, leveraging the warehouse’s power for performance and maintaining a single source of truth.
However, this approach can create challenges when multiple BI tools are in play. Not all tools connect easily to standardized SQL views, and complex metric logic can become difficult to manage at scale.
2. Standalone semantic service
Platforms like 5X offer the semantic layer as a dedicated service that sits on top of your data warehouse. These tools act as an analytics server, exposing a universal SQL endpoint so downstream tools view them as another database.
This model provides strong central control, consistent metrics across all tools, and advanced caching to accelerate query performance. The trade-off is an extra layer to manage, along with the need for performance tuning and monitoring.
3. BI-embedded semantic layer
Many BI platforms include their own semantic modeling layer, such as Tableau’s Logical Data Layer or Looker’s LookML. These are simple to adopt and improve consistency within a single tool.
The limitation is that these layers are proprietary and siloed. If your organization uses both Tableau and Power BI, you’ll need to duplicate metric definitions in each. This makes cross-platform consistency difficult and limits scalability.
If your company standardizes on one BI platform, using its native semantic layer is still better than managing definitions manually. It reduces inconsistencies within that ecosystem. But if you ever change tools, those models will not transfer.
A reddit user spoke about implementing a semantic layer for a few companies and what it solved.
4. Benefits of semantic layer
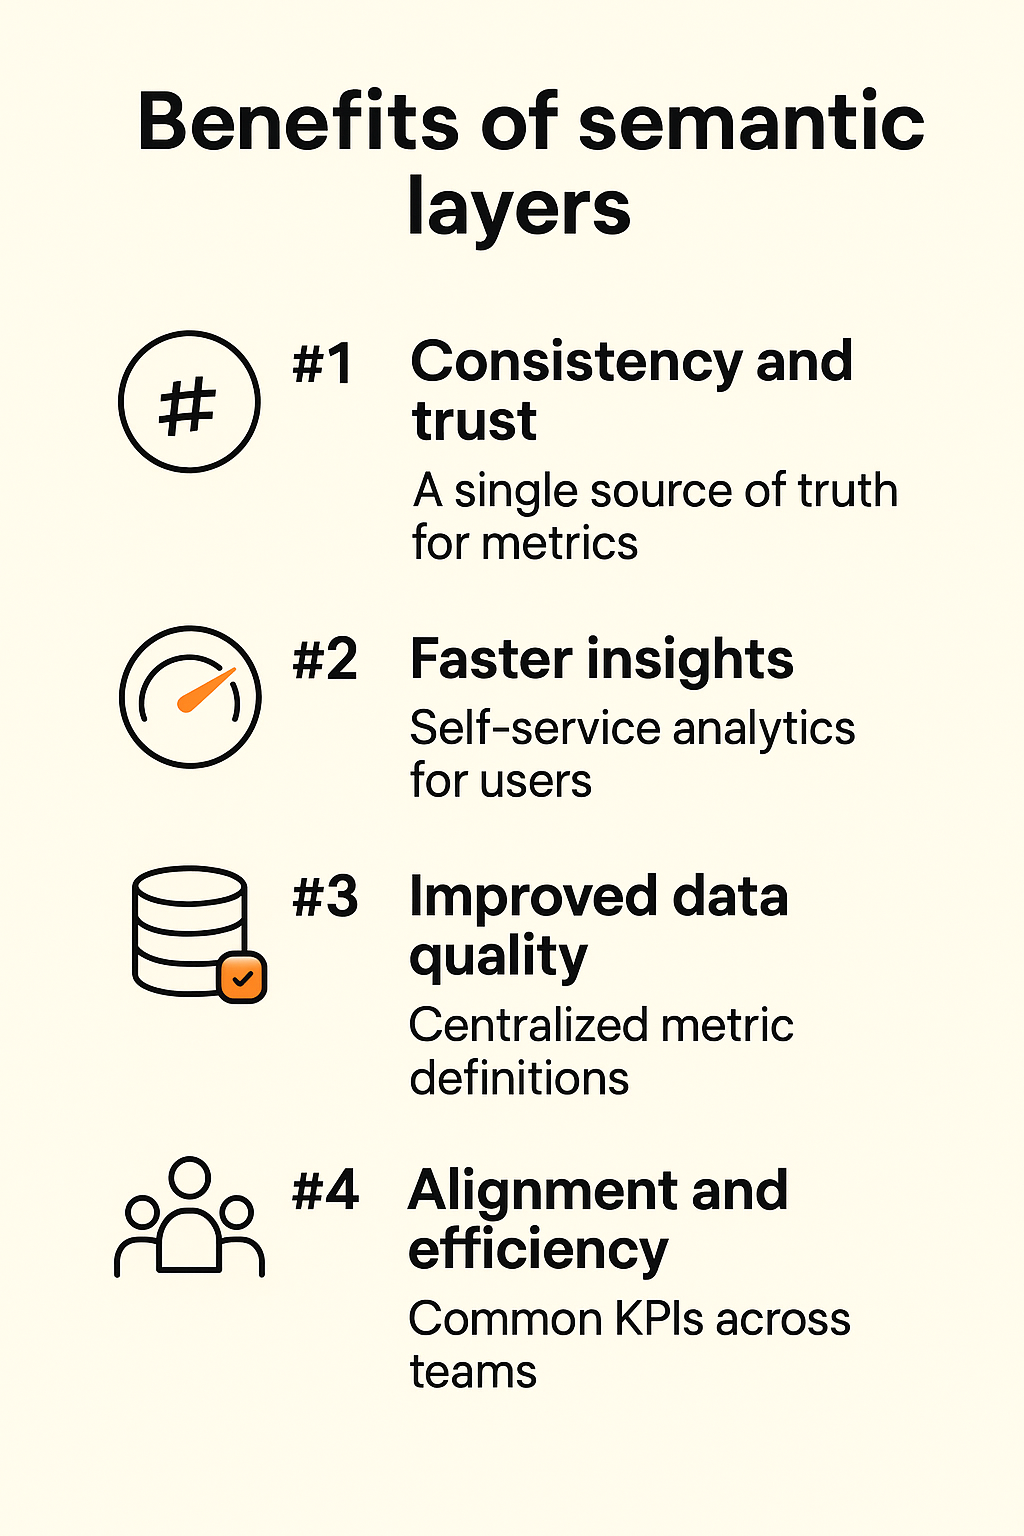
Why invest in a semantic layer? Simply put, it adds tremendous value in data trust, efficiency, and business agility. Here are the major benefits, backed by recent findings:
1. Consistency and trust in metrics
A semantic layer establishes consistent definitions for metrics and dimensions, ending the notorious “multiple versions of truth” problem. When every team uses the semantic layer, you no longer have marketing reporting one figure for “customer count” while finance reports another.
We’ve made Looker the face of our self-service platform. Looker’s robust semantic layer ensures that all teams have access to accurate and consistent data. By enabling self-service, we’ve not only improved efficiency but also fostered a culture of data-driven decision-making across the organization.
– Emily Loh, Director of Data, MoonPay
MoonPay’s blueprint for cracking self-serve analytics
2. Faster, self-service analytics
Data teams waste most of their time cleaning and reconciling data instead of analyzing it. Semantic layers fix that by delivering trusted, ready-to-use metrics.
With a semantic layer:
- Business users can get governed, real-time answers instantly
- Data teams focus on advanced analysis instead of report firefighting
- Performance improves with caching, pre-aggregation, and optimized queries
Also read: Data Analytics for Business: From Raw Data to Revenue
3. Reduced errors and improved data quality/governance
When every metric is defined centrally, it’s easier to enforce data quality and governance. The semantic layer can have built-in validations (for example, it might not allow a metric if the numbers don’t tie out, or it flags anomalies).Tthe chances of an individual analyst applying the wrong formula or filtering incorrectly go way down, since they rely on pre-vetted metrics.
A semantic layer introduces structure, validation, and guardrails.
Also read: Best Data Governance Tools in 2025
4. Cross-functional alignment and efficiency
The process of building a semantic layer forces conversations that greatly benefit an organization. It brings together finance, marketing, product, etc., to agree on KPI definitions. This cross-functional alignment has cultural benefits, it gets everyone speaking the same language and focusing on the business logic rather than arguing over data extraction.
Organizational benefits
- Common KPIs: Everyone aligns around the same performance measures
- Reduced conflict: Teams stop debating numbers and focus on improving them
- Operational efficiency: No more duplicate data pipelines or reports; one logic, many uses
- Agility: Change a definition once, and it updates across every tool instantly
5. Enabling advanced analytics and AI
The difference between traditional BI and agentic analytics is speed. BI tells you what happened last week. Agents can tell you what’s happening right now and what you should do about it.
~ Servando Torres, Founder, ControlThrive
How retail leaders unlock hidden profits and 10% margins
Beyond regular BI, a semantic layer sets the stage for more advanced use cases. When you have consistent core metrics, you can feed them into machine learning models or AI simulations confidently.
4. leading semantic layer tools and platforms
1. AtScale
AtScale positions itself as a stand-alone, enterprise-grade universal semantic layer. It virtualises metrics on top of your data warehouse, supports hybrid clouds, and recently introduced the Semantic Modeling Language (SML) in open YAML for metric definitions.
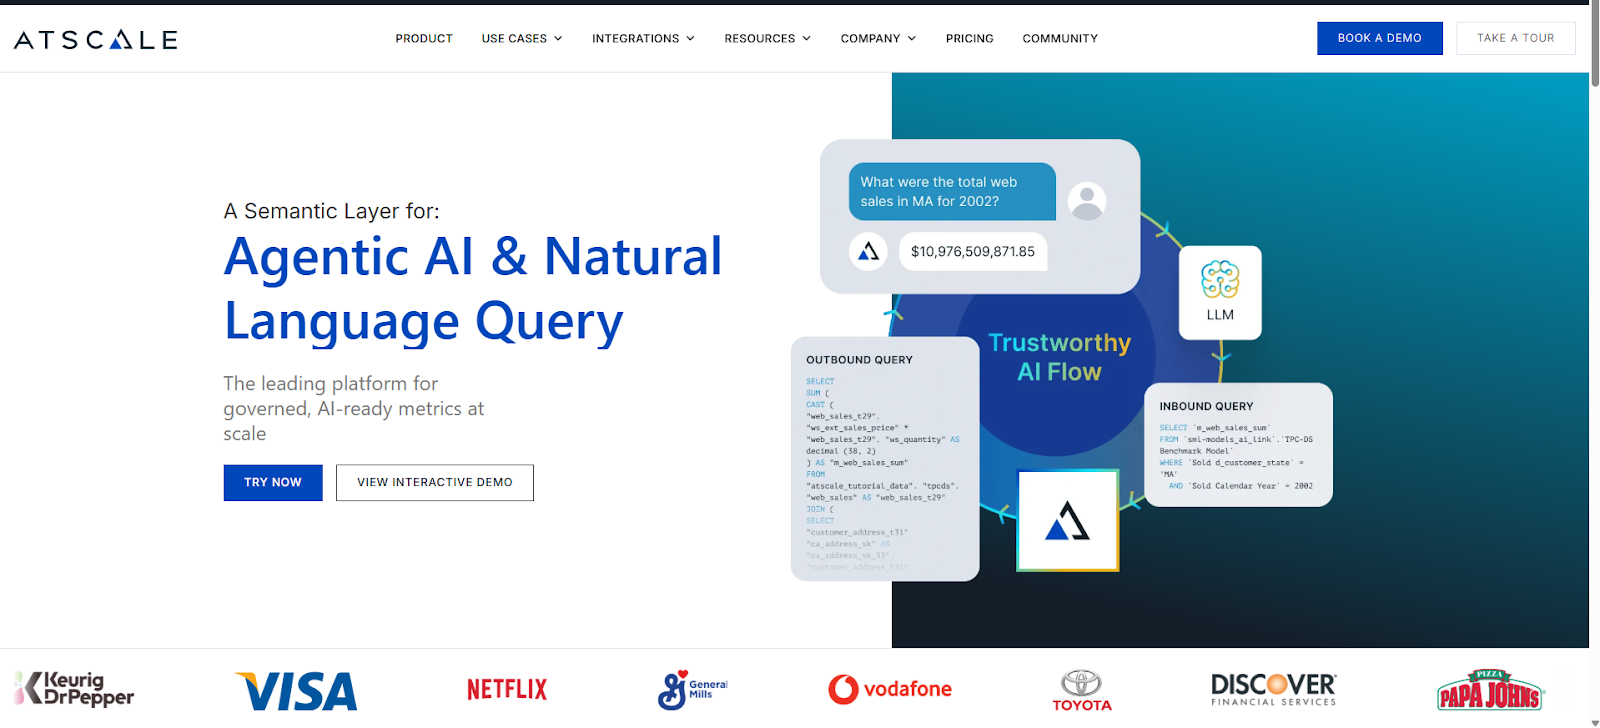
Strengths:
- Proven at large scale (Fortune 500 level) with rich features like caching, query acceleration, OLAP-style modelling and strong governance
- Broad tool support: Excel, Tableau, Power BI, Python, AI agents—everything hits the same metric store
- Built for performance and large datasets; heavy on security controls (row-level, masking)
Weaknesses:
- Proprietary: although SML is open-YAML, you still add an extra vendor/service layer
- Implementation complexity: you’ll likely need data engineering effort and model design upfront
- Cost: pricing tends toward large scale; may be heavy for smaller teams
- Learning curve: OLAP-style mentality may require analyst training
G2 rating: 4.5 / 5
2. dbt semantic layer
dbt’s offering takes a code-first, warehouse-level approach. You define metrics alongside your transformations in YAML, using MetricFlow under the hood.
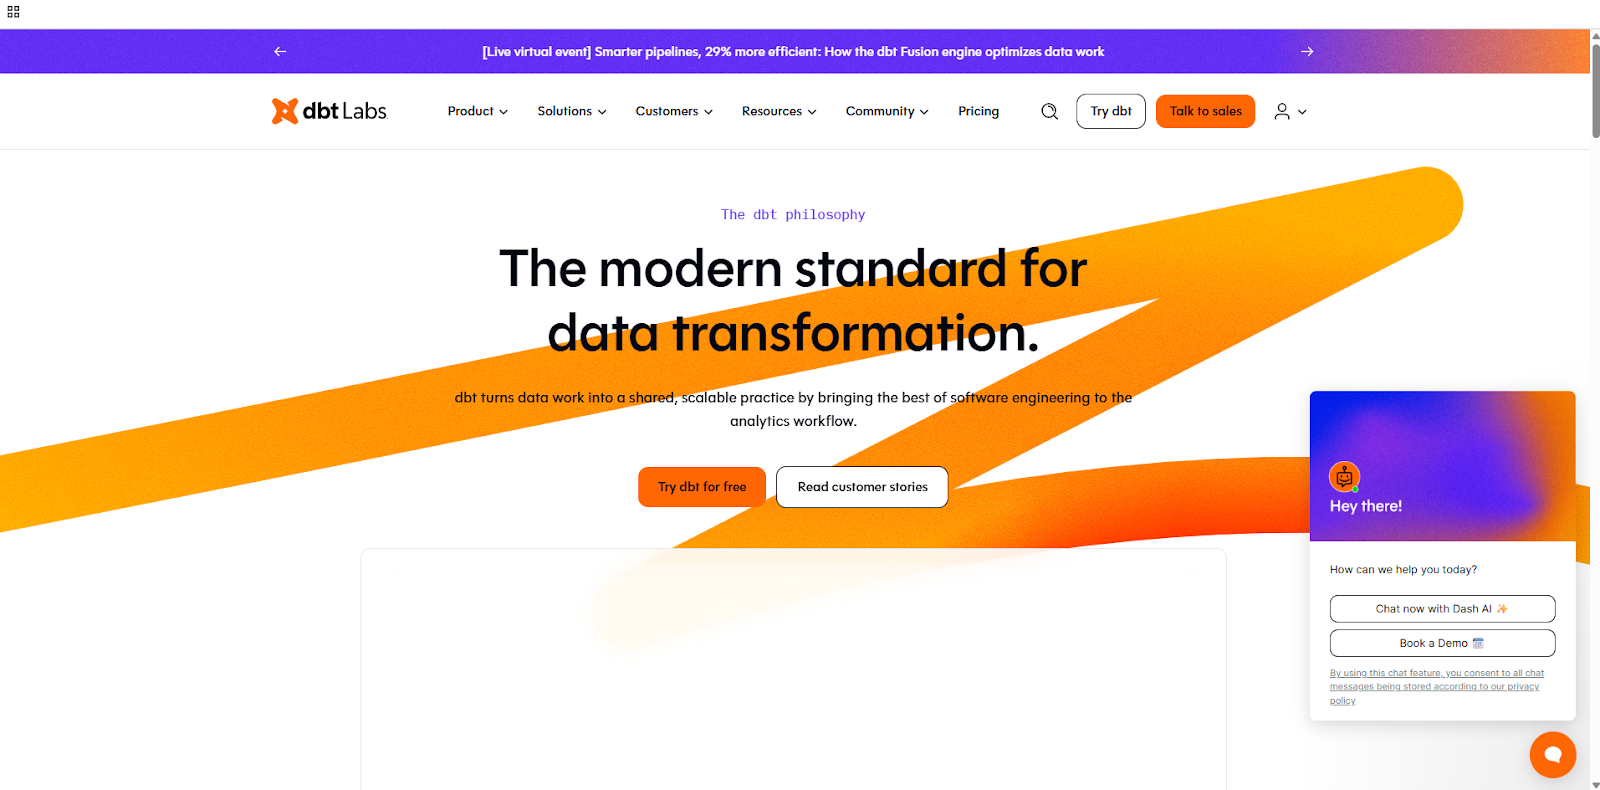
Strengths:
- Fits naturally into the dbt workflow, hence strong for analytics/data engineering teams already using dbt
- Open-source core (MetricFlow) and version-controlled definitions (metrics as code) are attractive for DevOps/CI/CD environments
- No additional server: the definitions live in your warehouse environment
Weaknesses:
- UI/UX for non-engineers is less mature; business users may struggle without data engineering support
- Tightly coupled with dbt ecosystem: if your stack is different, you may incur extra overhead
- Advanced metric logic may still demand significant SQL or coding; not always “plug-and-play”
3. cube (cube.js)
Cube offers an open-source headless semantic layer (via JS/YAML schema) that emphasises embedding and developer-friendly APIs (REST, GraphQL, SQL)

Strengths:
- Open-core model: strong community, no up-front heavyweight licensing for basic use
- Excellent for embedding analytics in applications, customizing experiences, and developer-led environments
- Advanced features: caching, pre-aggregation, API interfaces, and even AI-query readiness
Weaknesses:
- More engineering heavy: setup, maintenance, modelling often require developer resources
- UI and governance features may be less mature compared to full enterprise tools
- Focused on developer/embedded scenarios; business user tooling might require additional work
4. 5X semantic layer
5X delivers a semantic layer integrated into its broader modern data platform, built on an open-source foundation and designed for both speed and governance.
Strengths:
- Open-source foundation means lower vendor lock-in risk and flexibility to extend/modify the layer.
- End-to-end value: the semantic layer is not stand-alone but part of the 5X platform (ingestion, transformation, BI, AI) so integrations are smoother
- Business-user focus: UI for defining metrics in plain language, governance and change tracking designed for collaboration between technical and non-technical stakeholders
- Managed service aspect: For teams that want results quickly, 5X handles setup and ongoing support reducing in-house burden.
- AI-ready: Because the semantic layer is connected to BI and AI modules within the same platform, it supports use cases beyond dashboards (e.g., conversational analytics, LLM interfaces) without extra integration work.
Limitations:
- Newer in market vs legacy enterprises
- If you only need a semantic layer (and already have ingestion/transformation/BI in place), the broader platform may be more than you need (though modularity helps)
5X’s semantic layer is the differentiator, though, because it combines open-source foundation and full-stack platform. While many vendors focus solely on modelling or embedding, 5X brings together ingestion, transformation, semantic modelling, BI, and AI under one umbrella.
This means your semantic layer is not an after-thought but built-in. For teams targeting consistent governance, broad self-service analytics, and future-proofing for AI, this holistic architecture offers distinct advantages.
FAQs
What is the difference between the semantic layer and the data warehouse?
Is dbt a semantic layer?
Does a semantic layer replace my BI tools or LLMs?
Building a data platform doesn’t have to be hectic. Spending over four months and 20% dev time just to set up your data platform is ridiculous. Make 5X your data partner with faster setups, lower upfront costs, and 0% dev time. Let your data engineering team focus on actioning insights, not building infrastructure ;)
Book a free consultationHere are some next steps you can take:
- Want to see it in action? Request a free demo.
- Want more guidance on using Preset via 5X? Explore our Help Docs.
- Ready to consolidate your data pipeline? Chat with us now.
Get notified when a new article is released
Related articles
.png)

How retail leaders unlock hidden profits and 10% margins
Retailers are sitting on untapped profit opportunities—through pricing, inventory, and procurement. Find out how to uncover these hidden gains in our free webinar.
Save your spot