What is a Data and AI Maturity Assessment? How to Use It?

Table of Contents

TL; DR
In Oppenheimer, there’s a moment when theory collides with impact. When understanding the science isn’t enough and execution becomes everything.
That’s where most data leaders are today.
You’ve invested in tools. You’ve funded analytics. You’ve run pilot after pilot. Yet the organization still can’t answer basic questions with confidence. Or worse, everyone answers differently.
The data exists. The tech exists. The talent may even exist. But maturity is harder to pin down.
Only a small percentage of organizations have truly reached advanced levels of data maturity. The rest are stuck somewhere between experimentation and execution, burning time and budget on disconnected initiatives that never scale.
The reason is that most data programs lack a structured, outcome-focused maturity path. And most maturity assessments diagnose…but don’t deliver.
This article introduces a different approach. One built for action.
- A proven five-tier model, grounded in frameworks from Gartner and McKinsey
- A breakdown of the six dimensions that determine real AI and analytics readiness
- A clear model to bridge the gap between knowing and building
Your business doesn’t need another static assessment. It needs progress. Measured, scalable, and fast. So let’s see what it looks like!
What is a data maturity model?
A data maturity model is a way to measure how well your company uses data to make decisions. It tells you where you stand today and what you need to fix to get better.
The model breaks down your data practices across core areas like infrastructure, governance, analytics, and AI. Then it shows you how advanced (or outdated) you are in each one.
“Better AI isn't about more data; it is about the quality of data and its connectivity. We have assigned accountability to make sure that we just don't keep on saying the quality is bad, but keep improving it.”
~ Anindita Misra, Global Director of Knowledge Activation & Trust, Decathlon Digital
How Decathlon uses data to optimize in-store operations
For instance, if you’re still doing analysis in spreadsheets, you’re probably in Tier 1. Running real-time dashboards with governed datasets? You’re likely at Tier 3 or higher.
Why you need to measure your data maturity
90 % of organizations now view data as a critical asset (a leap from past years). But high regard doesn’t mean high impact.
Very few companies are actually able to drive successful business outcomes using data the right way. That gap is the problem: you might have data, but the business isn't winning.
“Data needs to be considered and intertwined with AI and machine learning to really unlock meaningful value. data only becomes powerful when we are able to do that. And conversely, it reaches its full potential when we have high quality data.”
~ Maddie Daianu, Senior Director, Data Science & Engineering, CreditKarma
Driving Financial Freedom with Data
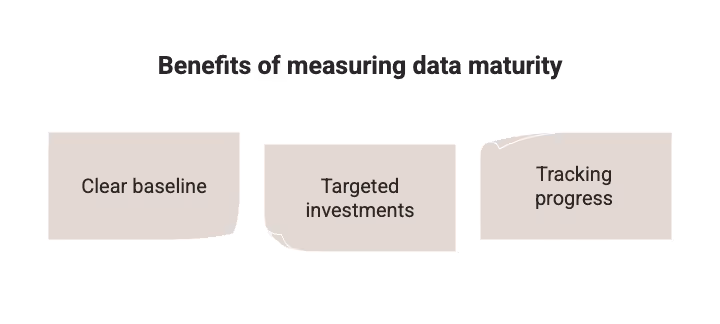
Measuring data maturity helps fix that. It aligns your teams and resources by:
- Providing a clear baseline, so tech, analytics, and business speak one language
- Targeting investments, so you upgrade only what matters most
- Tracking progress, so you know if maturity scores move forward or stall
Without measurement, you’re just guessing where effort should go. With it, you gain structure.
When your maturity model shows weak governance, you can invest in data quality tools. When it flags siloed analytics, you can unify dashboards across teams. Suddenly, every budget dollar follows a map.
Teams operate with more intent. Leadership hears one language: maturity scores. Finance knows why infrastructure spend matters. IT can prioritize better tooling. Analytics gets better at proving the ROI of your data team.
The 5 tiers of the 5X data maturity model
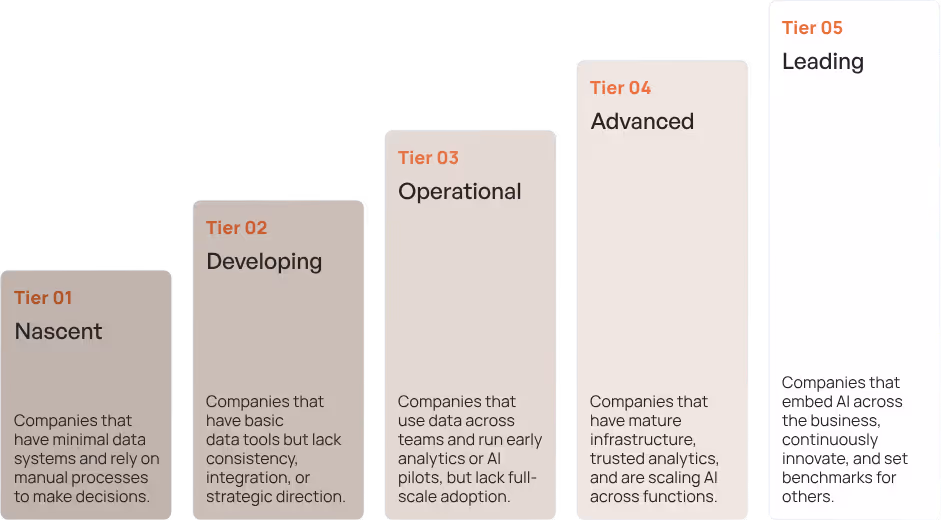
Leading frameworks from Gartner and McKinsey segment data maturity into five levels. These tiers map your progress from basic data chaos to full AI-powered decision-making.
Tier 1: Nascent
- Data lives in spreadsheets
- No governance or shared definitions
- Insights are opaque—no dashboards, no view across teams
- Decisions happen reactively, often after reporting failures
You know there's a problem, but you lack resources and structure.
Tier 2: Developing
- You’ve added tools—ETL, BI, data storage—but they operate in isolation
- Teams trust their own data versions; there's no single source of truth
- Governance exists in name only: rules are weakly enforced or ignored
Tier 3: Operational
- Your infrastructure runs reliably; pipelines and dashboards are in use
- You have basic data models and some trust in your metrics
- Governance is established and enforced
- Insights start to influence planning and quarterly decisions
Tier 4: Advanced
- Analytics is cross-functional—marketing, finance, ops share models and results
- You pilot machine learning, run A/B tests, and uncover predictive value
- Governance is mature: metadata, lineage, stewardship
- ROI is visible and repeatable
Tier 5: Leading
- You operate with an AI-first mindset
- Predictive and prescriptive systems guide real-time decisions
- Data automation is embedded across operations
- Data is a strategic asset, fueling new products and revenue
This is the top maturity level: fully data-driven, optimized, and continuously improving.
3 Biggest roadblocks in the maturity journey

Even promising data journeys hit unexpected dead ends early on. Here are the biggest obstacles:
1. Assessment fatigue after stage 2
Many organizations hit “analysis paralysis” once they move past basic data collection—teams get overwhelmed, and momentum evaporates.
That’s assessment fatigue: you’re doing all the right steps, but insights stall.
2. Siloed infrastructure: tools that don’t talk
Fragmented architectures block unified analysis. If your ETL, BI, and CRM systems don’t sync, you end up with blind spots and wasted effort. Data remains trapped in its own domain, and no one gets the full picture.
Also read: Best Data Consolidation Guide In 2025
3. Garbage in, garbage insights out
When infrastructure is fragmented and pipelines aren’t robust, data quality suffers. Unstructured data in silos leads to inconsistent outputs—and rising breach costs.
Poor inputs generate unreliable dashboards. Without trust, teams ignore insights; not because they lack data, but because it’s untrustworthy.
Also read: 7 Data Quality Metrics Your Business Needs to Track
These issues feed each other:
- Tools that don’t talk lead to poor-quality data
- Poor data leads to unreliable reports
- Unreliable reports drain trust and teams default to gut decisions
Moments like these are where most data efforts crumble. Without a structured maturity model, it's hard to spot the weak link or fix it cleanly.
What leaders need now
You need more than a one-time audit. You need:
- A clear view of where you hit checkpoints and why progression stops
- A targeted path to fix weak areas—governance, integration, infrastructure
- Momentum that doesn't stall; projects that build on each other
This is where the Data and AI Maturity Assessment by 5X breaks the cycle. It:
- Spots fatigue thresholds early
- Reveals infrastructure silos
- Highlights data-quality failures
- Maps weak spots with visual clarity
The Data and AI Maturity Assessment by 5X solves the “assessment vs action” gap
You need more than benchmarks; you need impact. 5X delivers both in one fast, structured package.
1. Built on proven frameworks, built for execution
- 15 questions inspired by top-tier frameworks from Gartner and McKinsey
- Each maps to six critical dimensions: data infrastructure, data modeling & quality, BI & dashboards, governance, predictive & prescriptive analytics, and AI applications
- Every response feeds a maturity score across all these areas, giving you precision
2. Tailored report with clear next steps
When you finish, you see:
- Your overall tier: From Nascent to Leading—based on where third-party benchmarks place you
- Slice-level details: Which dimension needs immediate attention. Is it governance? Modeling? Analytics?
- Personalized roadmap with prioritized tasks and timelines tied to your current tier
- Benchmark view shows where you stand against similar organizations
- A guide to advance to the next tier: Specific levers you can pull to unlock momentum, alignment, and real AI outcomes
3. Value at every maturity level
You don’t need to be “Leading” to see gains. Here’s how each tier benefits:
- Nascent: Turn spreadsheets into a reliable data foundation with governance templates and pipelines
- Developing: Connect systems, align metrics, launch QA checks
- Operational: Scale analytics and implement your first ML pilot.
- Advanced: Automate MLOps, optimize BI performance, and build cross-functional data apps.
You just need to start. And each step builds momentum.
Why it works for you and your org
- You get a clear score and a step-by-step plan
- Your engineers get templates, code, and guidance
- Your BI and analytics teams get trusted dashboards and better models
- Leadership finally has a path; no more endless assessments with no action
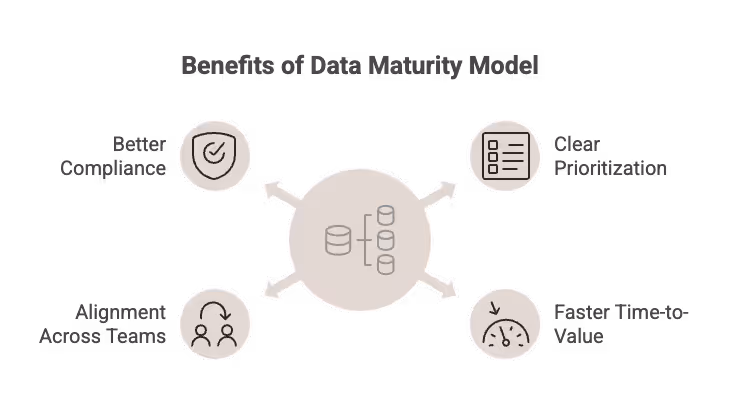
4 Key benefits of using a data maturity model
“A lot of AI is the quality of the data, which is where our focus is right now. What's the internal data that we want to feed these models, and what are the use cases that we want to unlock?”
~ Kiriti Manne, Head of Strategy & Data at Samsara
How Samsara’s Attribution Model Turns Data into Gold
A structured data maturity model offers strategic value across four core areas. For leaders, it’s the difference between intention and impact.
1. Clear prioritization of initiatives
A maturity model pinpoints exactly where to invest next.
- It flags weak spots—whether in governance, infrastructure, or analytics
- It ranks fixes by business impact
2. Faster time-to-value from data projects
When your next steps are clear, projects launch faster. You stop experimenting and start executing.
3. Alignment across tech + business teams
One shared maturity score gets everyone speaking the same language. No more cross-functional disconnects; just shared goals.
4. Better compliance and governance
As you mature, compliance becomes built-in, not manual. Mature models embed governance into policies, people, and technology, making regulatory alignment smooth and scalable. You reduce risk and ease audits, without the extra headcount.
When you use a data maturity model, you don’t just talk about data—you build it. You free up budgets. You create momentum. You earn trust.
That’s why leaders lean on maturity models to turn data into a reliable, scalable asset.
Take control of the future of your data
You’ve walked through the why, the how, and the what-next of choosing a data maturity framework. You’ve seen the gaps teams hit—assessment fatigue, siloed tools, poor data quality.
Now comes the critical step: turning that knowledge into progress.
The 5X Data and AI Maturity Assessment is designed to close the gap between planning and doing.
- It gives you a trusted maturity score grounded in Gartner and McKinsey frameworks
- It drills into six dimensions—Infrastructure, Modeling, BI, Governance, Analytics, AI—to pinpoint your next moves
- It takes 10 minutes to fill
Building a data platform doesn’t have to be hectic. Spending over four months and 20% dev time just to set up your data platform is ridiculous. Make 5X your data partner with faster setups, lower upfront costs, and 0% dev time. Let your data engineering team focus on actioning insights, not building infrastructure ;)
Book a free consultationHere are some next steps you can take:
- Want to see it in action? Request a free demo.
- Want more guidance on using Preset via 5X? Explore our Help Docs.
- Ready to consolidate your data pipeline? Chat with us now.
Related articles
.png)

How retail leaders unlock hidden profits and 10% margins
Retailers are sitting on untapped profit opportunities—through pricing, inventory, and procurement. Find out how to uncover these hidden gains in our free webinar.
Save your spot