Business benefits of cross-functional data collaboration and how to achieve it


Table of Contents

TL; DR
- Relying on a “data person” for every question slows down business decisions, often leading to missed opportunities
- Cross-functional collaboration ensures insights are enriched with context from marketing, sales, finance, product, and operations
- Key challenges include data silos, unclear ownership, skill gaps, and tool overload
- Benefits include sharper decision-making, better data accessibility and quality, faster analysis, and improved service performance
- Data leaders must set the right culture, unify strategy, centralize platforms, and push cross-team projects
- Data professionals should create reusable assets, document clearly, and translate complex insights into business language
- Non-data professionals must add value by engaging in discussions, leveraging visualizations, and building data literacy
The biggest blocker to collaboration is needing a “data person” every time you have a question. By the time they pull the numbers, the moment’s gone. And in that delay, opportunities slip away, decisions get stalled, and teams lose their momentum.
The traditional ticket-driven approach to data is too slow for today’s pace of business. In fast moving companies, marketing needs campaign insights now, sales needs lead conversions before the next client call, and operations needs supply chain alerts before turning into costly delays. Cross-functional data collaboration changes the game.
Read this blog post to learn about cross functional data collaboration, its business benefits, challenges of implementation and best practices you can follow to achieve them.
What is cross-functional data collaboration?
Data analysis is rarely a solo sport. Your analysts might know how to run the numbers, but they don’t always have the full story behind them. Marketing knows why last quarter’s campaign spiked traffic. Sales knows which deals stalled. Product knows which feature launches flopped or flew.
When these teams talk to each other, your data becomes a context-rich insight you can actually act on. Without collaboration, you risk chasing false trends, missing root causes, or making decisions that look good in a spreadsheet or business intelligence report but fail in the real world.
Cross-functional collaboration ensures that your data platform analysis is grounded in reality, enriched with multiple perspectives, and aligned with business priorities. It’s how you move from “what happened” to “why it happened” and, most importantly, “what we should do next.”
Common data team collaboration challenges
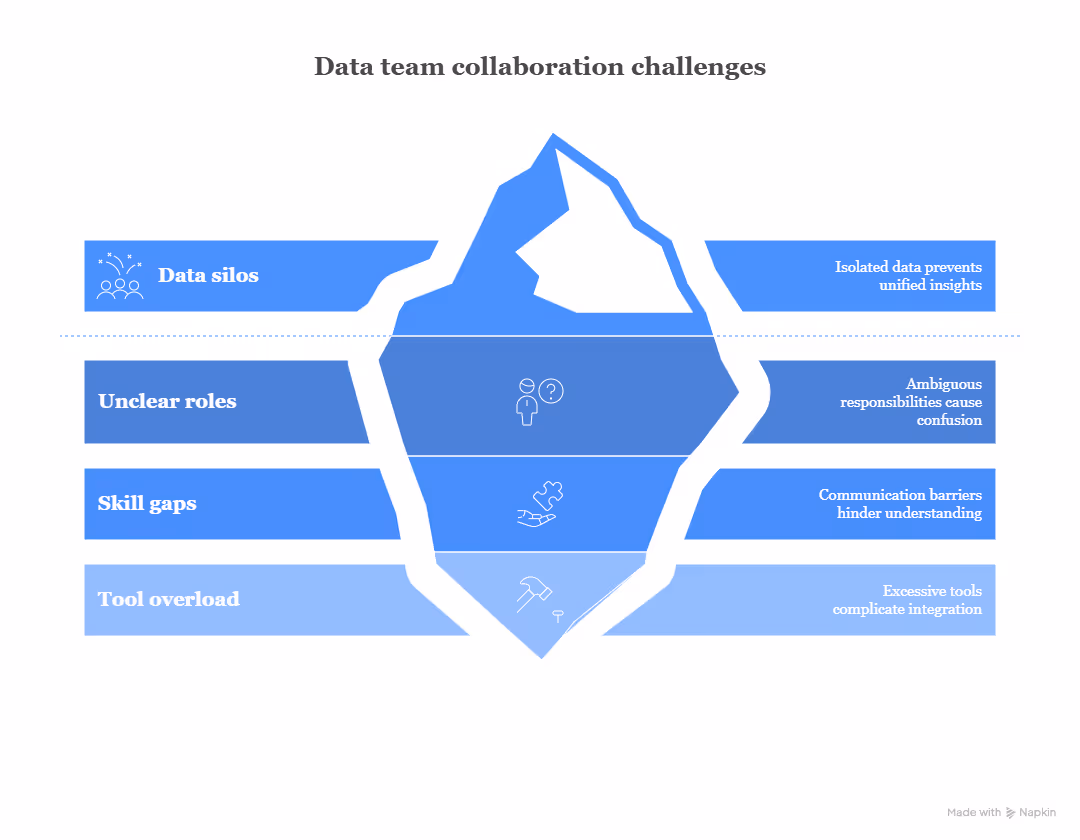
Working with data is about people, priorities, and processes. It’s rarely just about numbers and that’s where collaboration often gets tricky. Here are some common challenges:
- One of the biggest hurdles is data silos. Marketing has its metrics, finance has another, so does operations, and no one talks to each other. Without a shared source of truth, teams spend more time debating whose numbers are “right” than actually solving problems
- Second, there’s unclear roles and responsibilities. If no one knows who owns which dataset, dashboard, or decision, things fall through the cracks or worse, it get duplicated
- Third, different skill levels can also slow things down. Data scientists might speak in models and algorithms, while business teams need simple, actionable insights. Without a “translator” in the middle, valuable findings can get lost in jargon
- Fourth, tool overload is real. When every team uses a different data analytics tool, integration becomes a headache, workflows get messy, and collaboration suffers
Why is team data collaboration important?
Great data work doesn’t happen in a vacuum.
You can have the cleanest datasets and the sharpest dashboards, but if your finance, marketing, operations, and product teams aren’t talking, you’re only seeing part of the picture.
Team data collaboration bridges those gaps. It combines technical skills with domain expertise so you’re not just crunching numbers, but actively interpreting them in the right business context. Finance can flag revenue anomalies, marketing can connect them to campaign shifts, and operations can spot process bottlenecks hiding behind the metrics.
When teams share data, challenge assumptions, and build insights together, decisions get sharper, faster, and more aligned with company goals. Without that collaboration, you risk working in silos, duplicating effort, and making choices based on incomplete or misunderstood information. In short, data alone is powerful, but data shared across teams is transformative.
Benefits of collaborative analytics
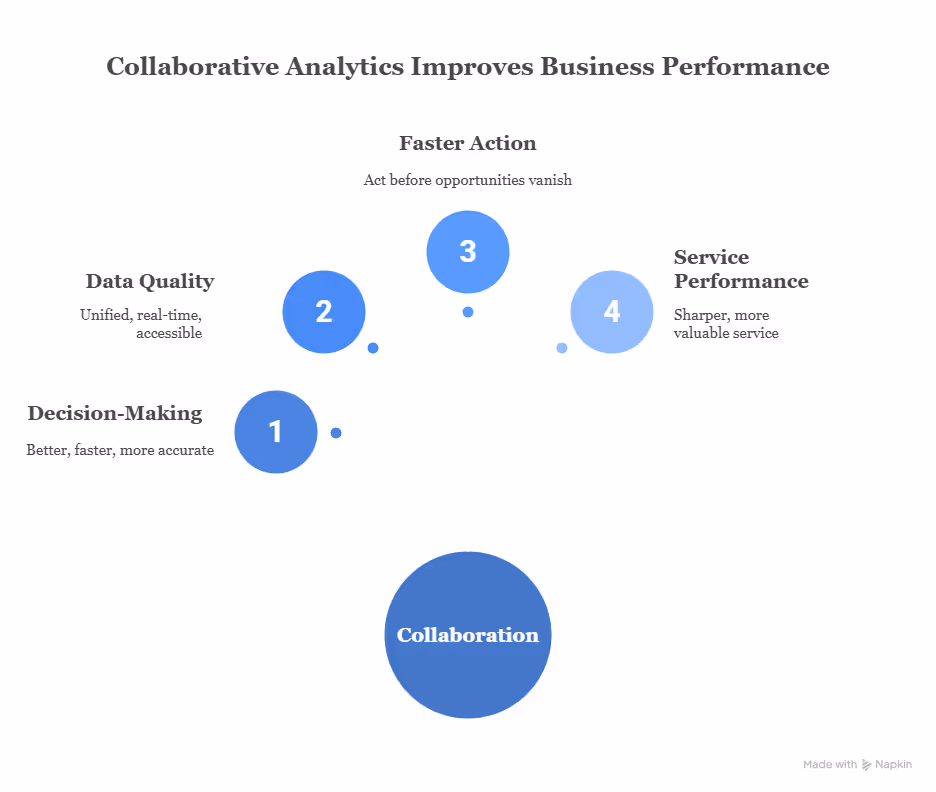
When analytics stops being a “back office” function and transforms into something the whole organization participates in, the results speak for themselves.
Collaborative analytics isn’t just about more people looking at numbers. It’s about more perspectives shaping the story those numbers tell. Here are its top benefits:
1. Improved decision-making
More perspectives mean fewer blind spots. When marketing, finance, operations, and product teams all contribute to analysis, you get a 360° view of problems and opportunities.
This leads to decisions that hold up under scrutiny.
For example, in retail, a fashion brand that involves store managers, supply chain planners, and e-commerce teams in sales trend analysis can make sharper buying decisions. Store managers know what customers are asking for, planners understand inventory constraints, and the e-commerce team sees what’s trending online. Together, they ensure stock, promotions, and marketing are perfectly aligned, avoiding costly misses and maximizing revenue.
2. Enhanced data accessibility and quality
When data is trapped in silos, it’s like each department is playing a different game with its own scoreboard and no one really knows who’s winning.
Collaborative analytics tools with integrated communication features break down these walls, giving everyone access to the same real-time, high-quality data. Unified data in a business leads to faster, more accurate decision-making across departments.
For example, in a large hospital network, patient care improves dramatically when doctors, nurses, and admin teams share access to integrated electronic health records. Doctors can see lab results instantly, nurses can update care plans on the fly, and administrators can spot resource gaps in real time. This coordination prevents delays, reduces errors, and improves patient outcomes
3. Faster analysis, faster action
Some insights have an expiry date. Wait too long, and the window to act closes.
Insights lose value if they arrive too late. By involving more people with relevant expertise early-on, you can accelerate analysis and act before opportunities vanish.
For example, in manufacturing, a consumer electronics company launching a new product can speed up time-to-market when engineers, procurement teams, and marketing analysts work together on sales forecasting. Engineers know production limits, procurement teams understand supplier timelines, and marketing can predict demand spikes. Such a collaboration shortens decision cycles, allowing the company to scale production exactly when the market is hottest.
4. Improved service performance
When diverse teams combine research insights, operational data, and customer feedback, service delivery becomes sharper and more valuable.
In hospitality, a hotel chain that merges data from guest surveys, housekeeping reports, and booking analytics can identify and fix service gaps before they turn into bad reviews. If the data shows that guests frequently complain about check-in wait times, operations can adjust staffing, marketing can update communication on peak hours, and customer service can address guest expectations.
This kind of connected analysis solves problems and elevates the entire guest experience, leading to repeat bookings and stronger brand loyalty.
3 Best practices for implementing cross-functional data collaboration
True data collaboration means no team is left guessing, no decision is made in isolation, and everyone from the C-suite to the front line knows they’re working from the same source of truth. But getting there requires different players in the organization to bring their A-game in very specific ways.
Here’s how data leaders, data teams and non-data professionals can make a difference:
1. Data leaders: Set the stage for collaboration
Data leaders aren’t just tech buyers, they’re culture builders. If you’re in this role, you don’t just decide on tools and budgets but govern how your organization thinks about data.
- Create a collaborative data culture: Make it clear that data is not a department but a shared responsibility. For example, hold monthly “data roundtables” where marketing, sales, and product teams bring challenges, and analytics teams share findings. This encourages input from every angle and gets everyone invested in solving problems together
- Build a unified data strategy: Your strategy should connect data directly to business outcomes. Instead of vague goals like “improve analytics” or “increase sales”, spell out the target for each team in each quarter or year. For example: “We’ll reduce customer churn by 5% this quarter using behavioral data. Finance will ensure that revenue metrics are accurate, product teams will align features with usage data”
- Implement a centralized data platform: If teams are pulling numbers from different places, you’ll waste hours debating whose data is right. Invest in one data platform, whether that’s a cloud data warehouse or a data mesh that serves as the single source of truth
- Promote cross-functional projects: Assign projects that require collaboration, like combining customer feedback analysis (CX team) with sales conversion data (sales team) to pinpoint why deals stall. This forces knowledge-sharing and builds trust between teams
2. Data professionals: Turn complexity into clarity
Data professionals make collaboration possible by creating reusable tools, documenting clearly, and turning technical outputs into business insights that non-technical teams can act on.
You’re the translators, the builders, and often the unsung heroes of collaboration. Without you, data stays raw, messy, and inaccessible.
Here’s how you can create cross-functional excellence:
- Create reusable data assets: Instead of building the same report 12 different ways for 12 different teams, standardize it. A “Weekly Business Pulse” dashboard with revenue, churn, and engagement metrics in one place saves hours across the board
- Develop clear documentation and data dictionaries: It’s not enough to deliver a chart. Explain what “Active User” means in your context. Is it someone who logs in daily or weekly? Without these definitions, teams make wrong assumptions and act on flawed interpretations
- Act as data translators: If marketing needs a forecast, don’t just send them a regression output. Explain what it means in their language: “If you increase your email frequency by 15%, you’ll likely see a 7% lift in conversions based on past campaigns”
3. Non-data professionals: Make data part of your everyday
If you’re a non-data professional, engage with metrics, ask better questions, and understand the story behind the numbers. You may not query the database yourself, but your participation can turn insight into action and make you active contributors to strategic decisions.
Here’s the roadmap you can follow:
- Participate actively in data discussions: Don’t nod through the metrics presentation. Ask questions. If operations show a dip in efficiency, ask “What changed last week?”. Your curiosity will connect the dots that others might miss
- Leverage data visualizations and summaries: If the raw numbers are overwhelming, lean on visuals. A supply chain manager might not read a 10-page report, but a heatmap showing delivery delays by region tells them exactly where to focus
- Invest in data literacy training: Even a basic understanding of correlation, trend lines, and margins of error will boost your confidence in conversations and help you spot red flags before they become issues
Achieve cross-functional data collaboration with 5X
Collaboration isn’t just about putting people in the same room. It’s about making it easy for anyone, in any department, to get answers without jumping through hoops. That’s where 5X comes in.
Using 5X conversational AI, anyone from marketing, operations, sales, or other departments can type a simple question in plain English (“Which product category grew fastest last quarter?”) and get the answer instantly. No SQL, no ticket queue, and no waiting time is needed.
And because 5X lets you build AI-powered apps right on top of your data, you can create self-serve tools for every team. A marketing dashboard that explains campaign ROI in simple terms. A product insights app that flags drop-offs in real time. Get what you need without bottlenecks.
With 5X, everyone becomes a contributor, decisions get made faster, and cross-functional collaboration stops being a wish list item and starts being your new normal.
FAQs
What is cross-functional data collaboration?
What are the main benefits of cross-functional data collaboration?
What tools are essential for cross-functional data collaboration?
What are the key metrics for measuring collaboration success?
Building a data platform doesn’t have to be hectic. Spending over four months and 20% dev time just to set up your data platform is ridiculous. Make 5X your data partner with faster setups, lower upfront costs, and 0% dev time. Let your data engineering team focus on actioning insights, not building infrastructure ;)
Book a free consultationHere are some next steps you can take:
- Want to see it in action? Request a free demo.
- Want more guidance on using Preset via 5X? Explore our Help Docs.
- Ready to consolidate your data pipeline? Chat with us now.
Related articles
.png)

How retail leaders unlock hidden profits and 10% margins
Retailers are sitting on untapped profit opportunities—through pricing, inventory, and procurement. Find out how to uncover these hidden gains in our free webinar.
Save your spot