Optimizing data platform performance: faster, leaner, smarter


Table of Contents

TL; DR
- A slow, inefficient data platform drains time and money, delaying critical insights. High-performing data platforms drive faster decisions and greater ROI
- Key issues: Poor data performance leads to frustrated teams, missed opportunities, and ballooning cloud bills
- Fixes: You can boost speed and cut costs by implementing proven optimizations: partitioning data, indexing or Z-order clustering, compacting files, caching frequent results, incremental loading, and regularly tuning queries
- Benefits: A leaner, faster platform means quicker insights, happier users, and significant savings. Organizations with optimized data platforms report 27% faster decision-making and 20% lower operating costs
- Check out 5X, an enterprise-grade, end-to-end data platform (GDPR, HIPAA compliant) deployable in your cloud or on-prem
Every second counts when you’re waiting on data. A sluggish, poorly optimized platform means slow insights, missed opportunities, and unhappy stakeholders.
Why does this matter? Because data-driven performance = business performance. Fast, reliable data empowers your team to make decisions at the pace of the market.
The good news is that you’re not stuck with a slow, bloated data platform. Just like tuning a sports car, you can tune your data platform for speed and efficiency.
In this post, we’ll break down why performance matters, which metrics to watch, the hidden costs of doing nothing, and a practical checklist to optimize your data platform for peak performance.
Why data platform performance matters
Here are a few reasons performance should be top of mind:
1. Faster insights, better decisions
When your platform can ingest, process, and query data quickly, decision-makers get timely insights. That can be the difference between seizing a market opportunity versus falling behind. In fast-moving industries, a slow dashboard or ETL job is a business risk. You want your team asking questions and getting answers in minutes, not days.
2. Higher user productivity & satisfaction
A snappy, well-tuned data platform means data analysts and business users spend less time waiting or troubleshooting, and more time doing valuable analysis. Poor performance, on the other hand, frustrates users. Imagine sales or marketing teams constantly hitting slow reports, eventually they lose trust in the data (or give up and go with gut instincts).
We shouldn’t operate in silos—it’s collaboration that truly drives success. Our engine integrates both data and context, with invaluable input from our customers and customer success teams. By bridging these gaps, we can address the most critical challenges that our customers and company face.
~ Sriram Sampath, Head of Data Analytics, Pleo
Pleo's proactive data strategy for customer success
3. Real-time responsiveness to customers
For many companies, data platform performance directly impacts customer experience. Think of a fintech app where users expect up-to-the-second account info, or an e-commerce site personalizing offers on the fly. If your data pipelines can’t handle real-time streams or your queries bog down, customers notice.
High performance enables features like live dashboards, instant recommendations, and dynamic pricing that can set you apart. It’s how Amazon and Netflix delight users by leveraging hyper-optimized data systems that respond in milliseconds.
4. Competitive and financial advantages
There’s a concrete ROI to performance. Data-driven organizations vastly outperform laggards: they’re not only more likely to hit strategic goals, but also see higher profitability. On the flip side, inefficiencies are expensive. Idle compute, endless reruns of long queries, and redundant data storage all rack up cloud costs.
We work with the customer care team to draft the answer of the tickets we receive on support. Here, the ROI is much easier to calculate because you have the average time to enter a ticket. We decreased the time to handle the tickets from the customer care representative by 50%!
~ Anaïs Ghelfi, Head of Data Platform, Malt
Malt’s data ROI framework to prove your data team’s worth in big, bold numbers
5. Scalability for growth
Finally, optimizing performance today prepares you for the data growth of tomorrow. As your business scales (more customers, more transactions, more complexity), a well-optimized platform can handle the load without degradation. If you neglect performance, you might cope fine at small scale but hit a wall later—often at the worst time (like when launching a new product or during holiday traffic). Investing in performance tuning and a solid architecture now gives you a buffer.
Also read: Driving Data-Driven Culture: Advice From Data Leaders at Freshworks, Samsara, and others
7 Key performance metrics for data platform performance
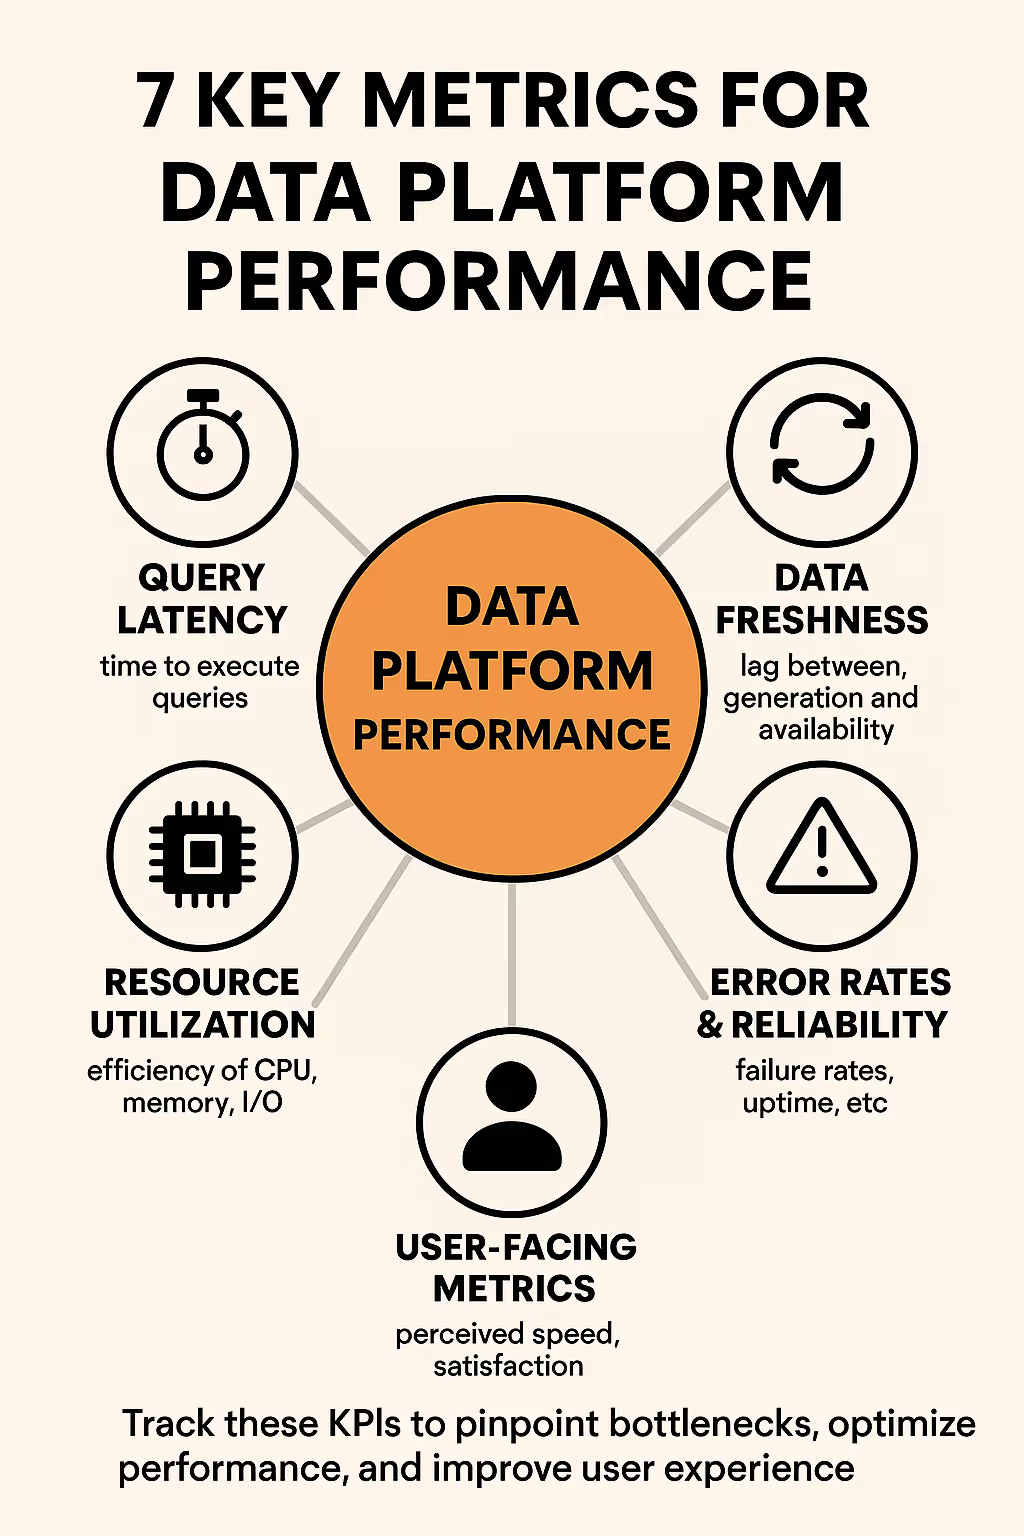
How do you know if your data platform is performing well or poorly? Let’s talk metrics. There are several key performance indicators (KPIs) and system metrics that you should track. Monitoring these will help you pinpoint bottlenecks and quantify improvements as you optimize.
1. Query latency (response time)
This is the time it takes to execute queries and get results. It directly affects user experience; lower query latency means faster dashboards and reports. Track metrics like average query time, 95th percentile query time (to see tail slow queries), and how these change under load.
If your average dashboard takes 10 seconds to load but certain complex queries take 5 minutes, you know where to focus optimization. Many teams set targets like “90% of queries return in < X seconds.” Reducing query latency is usually the #1 goal of performance tuning.
2. Throughput and concurrency
Throughput measures how much data your platform can process in a given time (e.g. rows per second in ETL, or queries per hour). Concurrency is how many processes or users can run in parallel without performance degradation. A high-performance data platform should handle increased workload without choking.
For example, can your data warehouse support 50 analysts running queries simultaneously during peak hours? If adding users or data volume causes dramatic slowdowns, you have a scalability issue. Metrics to monitor include number of concurrent queries, CPU utilization, I/O wait times, etc., during peak loads.
3. Data freshness (end-to-end latency)
This is the lag between raw data generation and that data being available for analysis. In other words, how “real-time” is your platform. If you’re doing batch loads, data freshness might be measured in hours (e.g. data is updated nightly). With streaming, it might be seconds.
Define SLAs for freshness based on business needs (e.g. “customer orders appear in dashboards within 5 minutes”). Then measure it, perhaps by timestamping data at ingestion and again when it’s queryable. Improving freshness often requires optimizing ingestion and processing pipelines (or adopting streaming). It’s a crucial metric if real-time insights are required.
4. Error rates/reliability metrics
Performance isn’t only speed, it’s also consistent reliability. A query that runs fast one day but times out the next isn’t dependable. Track failure rates for ETL jobs, error counts for dashboard loads, and uptime for data services. If your nightly ETL fails 1 in 10 runs or your BI tool frequently hits “server unavailable” errors, users effectively experience a performance issue (since they can’t get data when needed).
High-performing platforms have strong DataOps practices to minimize errors and quickly recover from failures. Reliability metrics include successful job execution rate, mean time to recovery (for incidents), and system uptime percentages.
5. Resource utilization and efficiency
Keep an eye on how efficiently your platform uses resources like CPU, memory, disk, and network. Performance issues often show up as resource saturation, e.g. CPUs pegged at 100% or disks hitting I/O limits. Conversely, very low utilization might indicate over-provisioning (wasting money).
Key metrics: CPU utilization %, memory usage, disk I/O throughput, cache hit ratios, etc. If you see, say, CPU constantly maxed during peak hours, that correlates with slow queries, time to consider query tuning or scaling compute. Tracking cost-related metrics like cost per query or per terabyte processed is also useful; it ties performance to financial efficiency.
6. Data pipeline execution time
If you have scheduled data transformation or loading jobs, measure how long they take and whether that’s growing. For example, your nightly batch that used to finish in 2 hours now takes 5. That trend indicates performance degradation as data volume grows. Pipeline latency metrics (by job or by step) let you pinpoint slow stages.
Maybe a particular transformation is the culprit (and could benefit from optimization or incremental processing). Tracking pipeline timings ensures your data availability SLAs (e.g. “reports ready by 8am”) are met. If not, you’ll need to speed up those jobs via better SQL, more parallelism, or bigger resources.
8. User-facing metrics
Finally, consider qualitative metrics that capture user perception of performance. For instance, survey your analysts on satisfaction with report speed, or track the number of complaints about “the BI tool is slow this week.” You can also instrument your BI front-end to log how long dashboards take to render for end-users.
Sometimes average query time might look fine, but from a user clicking a dashboard to seeing all visuals, it’s much longer. Capturing that end-to-end experience (including any client-side rendering) is important.
Don’t just collect metrics; make them visible
Consider creating a performance dashboard for your data platform itself . This could include charts for daily query counts vs. average duration, pipeline runtimes, etc. Share it with your team and stakeholders. This not only demonstrates improvements over time, but also catches regressions early. If yesterday’s deploy caused a spike in error rates or a dip in throughput, you’ll see it and can act fast.
6 Drawbacks of poor data platform performance

What happens if you ignore your data platform’s performance issues? In short, nothing good. Failing to optimize can lead to a slew of problems that hurt your business in both obvious and subtle ways.
1. Slow decision cycles
When reports and analyses take forever, your whole decision-making process bogs down. Teams end up waiting on data instead of acting on it. For example, if generating a weekly sales report is a half-day endeavor due to slow SQL queries and pipeline delays, managers might make decisions on old data or postpone decisions entirely.
2. Frustrated employees & shadow IT
People can only tolerate sluggish tools for so long. When internal users lose patience with the official data platform, they often seek workarounds. This might mean exporting data to Excel to do analysis locally, or spinning up their own rogue databases and spreadsheets (“shadow IT”). Not only does this create data silos and governance nightmares, it also indicates your investment in the platform isn’t delivering value.
3. Higher operational costs
Ironically, a poorly optimized platform often costs more to run. Inefficient processes waste compute and storage. For instance, scanning an entire 100 million row table for every query (because of no partitioning) burns far more CPU than necessary.
Running an oversized cluster to brute-force performance (because you haven’t optimized code) means you’re paying for hardware or cloud resources that better tuning could eliminate. And consider engineering time: how many hours are lost investigating slow jobs or managing performance fires? All that has a labor cost.
4. Inability to scale or onboard new use cases
A poor-performing platform is usually operating with very little headroom. Throw any additional workload at it (new data sources, more users, more complex queries) and it collapses or slows to a crawl. This rigidity hampers innovation.
Essentially, poor performance = lack of scalability. It’s a ceiling on your data ambitions. We often talk about data platform scalability in terms of volume (more data) and velocity (faster data), but don’t forget variety and users—a system that can’t smoothly onboard new data types or support more people will hold your business back.
5. Bad data (quality issues)
“Data needs to be considered and intertwined with AI and machine learning to really unlock meaningful value. data only becomes powerful when we are able to do that. And conversely, it reaches its full potential when we have high quality data.
~ Maddie Daianu, Senior Director, Data Science & Engineering, CreditKarma
Driving Financial Freedom with Data
Believe it or not, performance issues can lead to data quality issues too. For example, if a critical ETL job takes so long that it overruns and fails, you might end up missing data loads or having partial data in your warehouse. Or teams start creating manual extracts to speed things up, which fall out-of-date and create inconsistencies. Over time, the official “source of truth” becomes unreliable not just speed-wise, but content-wise.
When pipelines are optimized and running smoothly, data quality tends to be higher (because jobs finish in windows, there’s less need for manual intervention, etc.).
6. Poor customer experience & lost revenue
If your data platform directly powers customer-facing features (analytics in your product, personalization, recommendations, etc.), performance issues there can degrade your product’s user experience. For instance, a slow recommendation algorithm might mean users wait to get content suggestions, or an e-commerce site timing out on data-driven pages can hurt sales. In the worst case, if your platform goes down or is too slow, it could even lead to downtime in customer-facing systems.
Also read: 8 Best Data ROI Tools for Marketing and Sales
Uplift your data platform’s performance without compromising on security
Improving your data platform’s performance means you get happier users, stronger financial outcomes, and new capabilities that drive innovation. Perhaps most importantly, you turn your data platform into a true enabler of business strategy rather than a bottleneck.
The right platform and partners can accelerate this journey.
For example, 5X’s modern data platform is designed with many of these optimizations—from an open-source, high-performance architecture to enterprise-grade automation. It’s built to handle the heavy lifting (with encryption, compliance, and governance baked in) while deploying in your own cloud or on-premises environment for full control.
If your organization is looking to quickly uplift your data platform’s performance without compromising on security or flexibility, 5X might be the catalyst you need. We’ve helped companies achieve results like 3x faster time-to-insight and major cost reductions.
FAQs
What’s the difference between optimizing for speed vs. cost?
How can automation improve data platform performance?
Building a data platform doesn’t have to be hectic. Spending over four months and 20% dev time just to set up your data platform is ridiculous. Make 5X your data partner with faster setups, lower upfront costs, and 0% dev time. Let your data engineering team focus on actioning insights, not building infrastructure ;)
Book a free consultationHere are some next steps you can take:
- Want to see it in action? Request a free demo.
- Want more guidance on using Preset via 5X? Explore our Help Docs.
- Ready to consolidate your data pipeline? Chat with us now.
Related articles


.png)

How retail leaders unlock hidden profits and 10% margins
Retailers are sitting on untapped profit opportunities—through pricing, inventory, and procurement. Find out how to uncover these hidden gains in our free webinar.
Save your spot