Data analytics ROI: How to measure the business impact of analytics
.avif)

Table of Contents

TL; DR
You invested in top-tier analytics talent. You built dashboards. You might even be running predictive models. But is it creating a real impact for your bottom line?
Many teams struggle to connect their analytics efforts back to tangible business outcomes. And this often happens because they don’t know how to measure the impact of their data investments.
In this blog, we’ll explore what data analytics ROI looks like in the real world, why it’s tricky to measure, and how to ensure your analytics investments drive impact, not just insights.
What is data analytics ROI?
Data analytics ROI helps you calculate the measurable return that your organization gets from its investment in data analytics tools, platforms, talent, and time.
High ROI means that your investment in analytics is helping you save costs, grow revenue, make faster decisions, or reduce risk. It also means that your data analytics initiatives are driving results that move the business forward and drive true results.
Simply put, data analytics ROI is the tangible contribution of your analytics team (or a particular data initiative) to your business. Calculating it is rarely straightforward and often requires in-depth evaluation before you can confidently report numbers.
Santiago Tacoronte, Chief Data Officer, Mondelēz International
Why is measuring data analytics ROI important?
Measuring data analytics ROI optimizes your business returns. It helps you understand what’s working, what’s not, and where to focus your efforts for maximum impact.
Without measuring ROI, you risk wasting resources on analytics that look good but don’t drive real results like increased revenue, cost savings, or better decisions.
How do you calculate data analytics ROI?
Data analytics ROI is calculated by comparing the financial gains from your analytics initiatives and mapping it against the total costs it took to implement them.
Here’s the formula you can use to calculate the ROI of your data analytics efforts:
Data ROI = (Data product value – data downtime) / data investment.
Top CXOs are rethinking their data stack in 2025. Read this guide to evaluate platforms strategically, avoid hype, and future-proof infrastructure with minimal re-platforming.
Read: 2025 Data Platform Buyer’s Guide
Key factors to consider when you measure data analytics ROI
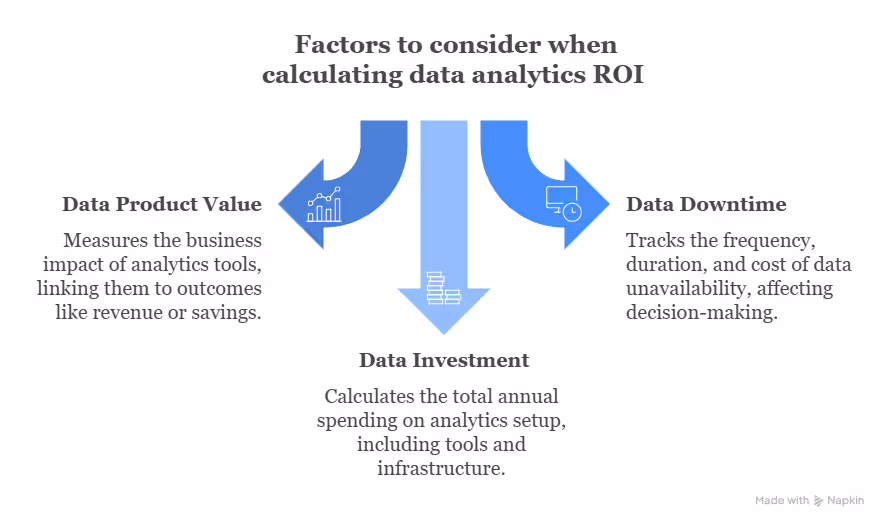
Your data product value, data downtime, and total investment in data initiatives are some factors you must consider when calculating your data analytics ROI.
Here’s what they mean and why they are important:
1. Data product value
This is the measurable business impact of your analytics tools (dashboards, reports, or models).
For example, a predictive model that boosts win rates by 10% or a dashboard that cuts ₹1.5 crore in waste. Track value by linking each tool to clear outcomes like revenue, savings, or efficiency.
2. Data downtime
Imagine your finance team is trying to close the quarter, but their dashboard won’t load or the numbers don’t add up. That’s data downtime.
Think of data downtime like a power outage for your analytics. Your tools might slow down, show errors, or just stop working. For teams trying to hit targets or close books, that’s a big problem. You lose time, confidence, and sometimes serious money.
It causes delays, confusion, and missed opportunities. To keep it in check, track how often it happens, how long it takes to fix it, and what it costs the business in time or bad decisions.
3. Data investment
Your data investment includes everything you’re putting into your analytics setup such as your tools, cloud storage, employee salaries, training, and infrastructure.
What you’re spending in a year across all these areas becomes your baseline investment. Getting a clear picture of this total investment helps you compare it to the business value being generated.
Challenges of calculating data analytics ROI
Measuring the ROI of data analytics sounds simple. But in real life, it’s anything but. Here are some challenges of calculating your ROI from data analytics accurately:
- Messy attribution: Let’s say your sales go up. How do you know for sure what caused it? Was it the new dashboard? The marketing campaign? A better sales script? Probably a mix of all three. Data often guides a decision, but rarely acts alone. And that makes it hard to pinpoint exactly how much impact it contributed to your bottom line
- Intangible value is real but tricky to measure: Another challenge is value you can’t touch that matter. This may include better decisions, faster responses, and lower risk. They don’t come with a price tag or show up on a balance sheet, making it difficult to measure them
- Poor tracking: If you don’t know who used a report, how they used it, or what changed because of it, you cannot accurately prove its worth. For many teams, that kind of documentation might just not exist
- Timing can be tricky: You might spend big on a new analytics platform today, but not see the payoff until next year. That mismatch can make your ROI look worse than it is
- Everyone measures ROI differently: Different teams measure value in different ways, resulting in chaos. One team counts time saved. Another measures dollars earned. This results in confusion, misalignment, and messy data about your data
What are the top data analytics KPIs you should track?
Data analytics KPIs (Key Performance Indicators) are measurable values used to evaluate the effectiveness and impact of data initiatives. They track how well data tools, processes, and insights support business goals, covering various metrics. These include:
Adoption and usage KPIs:
- Number of active users: How many people are regularly using data tools
- Dashboard usage frequency: How often key dashboards are accessed
- Repeat engagement rate: Are users coming back to use the data tools consistently?
- Tool adoption rate: % of target users who have started using a new analytics tool
Data quality KPIs:
- Data accuracy: % of correct and error-free records
- Data freshness: How up-to-date the data is
- Missing data incidents: How often reports/Dashboards are incomplete
- Duplicate records: % of duplicated data entries
Operational KPIs:
- Data downtime: Time when reports or dashboards are unavailable or unreliable
- Issue resolution time: How long it takes to fix data errors or outages
- Query performance time: Speed of dashboards or data queries
Impact and value KPIs:
- Insights-to-action rate: How often data insights lead to real business decisions
- Cost savings or revenue impact: Tangible value generated by data-driven decisions
- Project ROI: Return on analytics investments tied to specific projects
Alternate methods to measure data analytics ROI
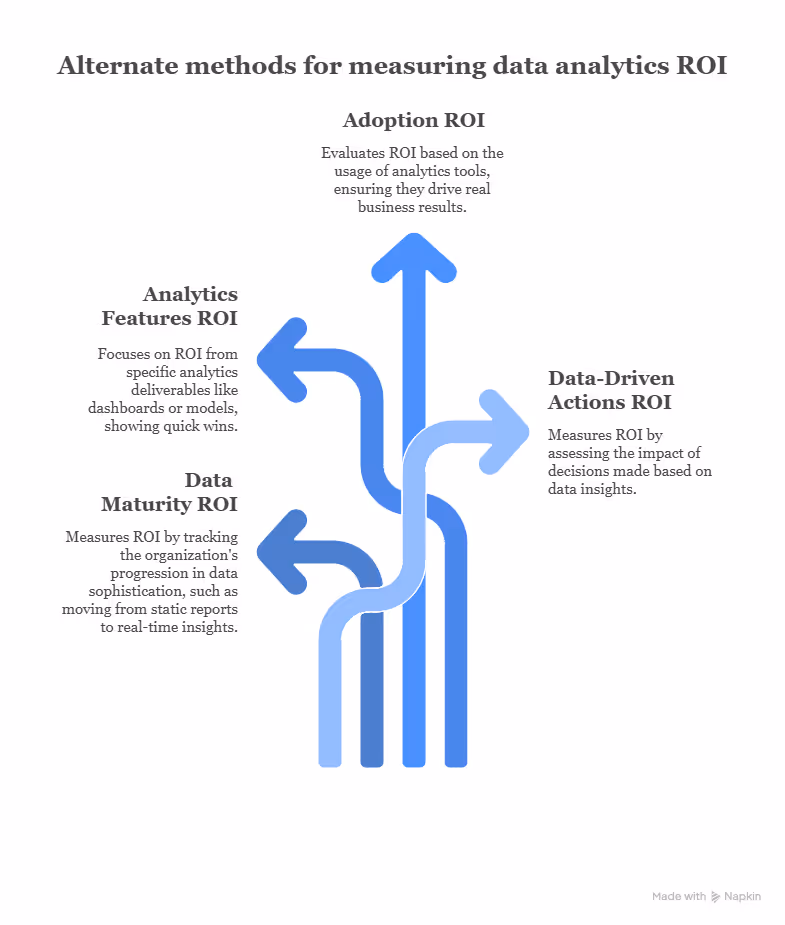
As companies get more advanced with analytics, they often need more flexible ways to show value.
Beyond the usual formula, here are four smart ways you can leverage to calculate your ROI when analytics becomes a core business process:
1. ROI from data maturity
As you move from basic reporting to real-time insights or predictive analytics, the value you get from your data increases. Calculating ROI from data maturity looks at how your ROI improves as your organization makes the transition to becoming more data-savvy.
For example, when a company upgrades from static monthly reports to real-time forecasting, helping leadership make faster, better decisions, it shows a clear ROI on data maturity.
You can measure this using factors such as:
- How many teams use self-service analytics
- How quickly people go from data to action
2. ROI from analytics features and product increments
Instead of measuring ROI for your entire analytics program, calculating ROI from feature changes or product increments focuses on specific deliverables like a dashboard, a model, or a new metric.
A dashboard may help a company avoid a $100,000 supply chain issue that only cost $10,000 to build. That’s a 900% return on that specific product.
This approach is ideal for agile teams that want to show quick wins.
3. ROI from adoption
Adoption-based ROI connects the value of your analytics tools to its usage.
If your team is not using the reports, dashboards, or data models built by your analytics team, you're not getting the full return on your investment, no matter how great the tools may be.
To understand the real impact, track how often people log in, total number of active users, and how frequently they come back. These usage patterns show if your tools are driving real business results.
4. ROI from data-driven actions
This way of measuring ROI focuses on what actually happens after you act on data.
Instead of trying to calculate the value of a dashboard or report, it asks: did this insight lead to real change? Did the business benefit from that change?
For example, if the marketing team shifts budget based on campaign performance data and then sees a 30-40% boost in ROI, the value lies in the decision the data enabled, not in the report itself.
Best practices for measuring and maximizing data ROI
Maximizing the ROI of your data efforts isn’t always straightforward. With multiple teams involved, many tools in play, and outcomes that aren’t always clear, it can feel like trying to hit a moving target.
Tools alone don’t create value. To see real outcomes, go beyond the numbers and embed your tools into the way your business thinks, works, and makes decisions.
Here are a few best practices to correctly maximize the pay-offs:
- Start with clear goals and metrics: Before you begin any analytics project, define what success looks like. Ask if you’re trying to cut costs, boost revenue, speed up reporting, or improve accuracy. Clear goals help you track real progress and connect it to business impact
- Prioritize projects based on outcomes: Not all analytics projects are created equal. If you want real ROI, prioritize projects that tie directly to business outcomes like revenue growth, cost cuts, or hitting strategic targets. Ask if an insight generated from a dashboard will help someone take better action. If not, rethink it
- Enable data literacy: When more people understand and use data, more value gets unlocked. Run workshops, create bite-sized training, and choose tools that are easy to navigate to empower team members to confidently ask and answer questions with data
- Build for adoption: If your tools are clunky, no one’s going to use them. Design with the end user in mind by offering self-service dashboards. Keep interfaces clean and intuitive to minimize the number of clicks to answers
- Measure both hard and soft benefits: Don’t just count revenue or cost savings. Include time saved, better decisions, or faster reactions. For example, if a dashboard replaces manual reporting, estimate the hours saved and what that’s worth as these small wins add up
- Calculate hidden costs: Add up every cost such as the price of software, staff time, training, cloud costs, and maintenance charges. Leaving things out (like engineer hours or support) makes your ROI look better than it really is
- Don’t ignore lost value: If your data tools go down, or people don’t trust or use them, that’s lost ROI. Track things like downtime, errors, or low adoption
- Match your timeframe: Compare returns and costs over the same time period. If your analytics solution delivered ₹10 lakhs in value over 6 months, don’t compare it to 12 months of platform fees. Use the same time period to assess both costs and benefits. Otherwise, your ROI calculation won’t reflect reality and you might make bad investment decisions
- Iterate like a startup: Analytics tools aren’t a “set it and forget it.” Keep checking if people are still using a dashboard, if the data you are using is still relevant, and if your business needs are being met. Collect feedback, track performance, refresh reports, and continuously improve your analytics products
Make smarter, faster decisions with 5X’s conversational BI
Business leaders often get tangled in complex dashboards, siloed access, and long turnaround times from analysts. Not anymore as 5X changes the game.
With 5X Business Intelligence, you get instant, AI-powered insights in natural language and get answers to questions like what’s driving the regional profit margin variance this quarter, where are your overspending, and which customer segments have the highest lifetime value right now.
In other words, 5X puts enterprise-grade analytics into the hands of your leadership team, reducing dependency on data teams, accelerating strategic pivots, and maximizing ROI.
What is Data Analytics ROI, and why is it important?
How do you calculate Data Analytics ROI?
What are the biggest challenges in measuring Data Analytics ROI?
Building a data platform doesn’t have to be hectic. Spending over four months and 20% dev time just to set up your data platform is ridiculous. Make 5X your data partner with faster setups, lower upfront costs, and 0% dev time. Let your data engineering team focus on actioning insights, not building infrastructure ;)
Book a free consultationHere are some next steps you can take:
- Want to see it in action? Request a free demo.
- Want more guidance on using Preset via 5X? Explore our Help Docs.
- Ready to consolidate your data pipeline? Chat with us now.
Related articles
.png)

How retail leaders unlock hidden profits and 10% margins
Retailers are sitting on untapped profit opportunities—through pricing, inventory, and procurement. Find out how to uncover these hidden gains in our free webinar.
Save your spot