Table of Contents

TL; DR
Quick-service restaurants face a twin challenge: delivering food quickly and maintaining freshness. Most QSR chains fail at this.
One of our QSR clients faced a challenge in serving quick, fresh protein in their bowls. The SOP required serving within 15 minutes, but it's tough in a busy restaurant. Our team questioned if the SOP needed adjusting and set out to find answers.
The 5X approach
Our engineers devised an ingenious solution: conducting video analysis to validate adherence to the SOP.
While manual tracking was an option, the staff's busy schedule made it impractical.
This method promises more accurate results without disrupting operations. Plus, it's scalable, allowing other outlets to analyze similarly.
The next step was to finalize the tooling. Many video analytics and image processing algorithms are available in the market.
But they need to be trained on huge custom data. So, our engineers chose an open-source, state-of-the-art algorithm that excels at real-time object detection.
The team developed an image processing machine learning model using the algorithm.
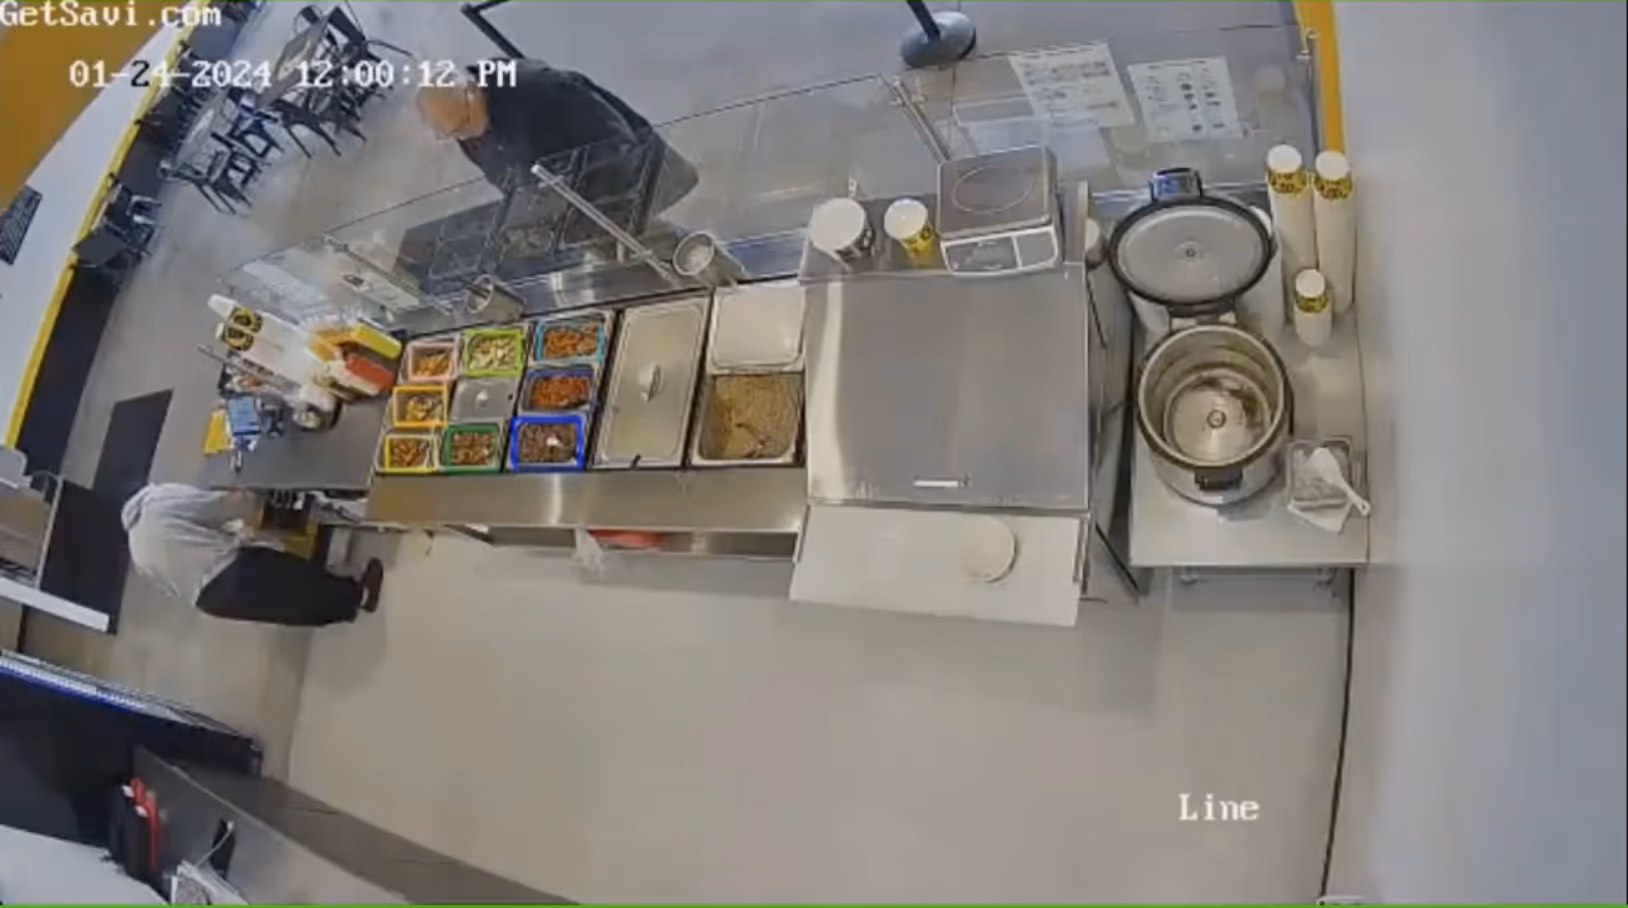
Two days of security camera footage was then fed into the algorithm. They trained the model on custom data to detect full vs. empty containers from the security footage.
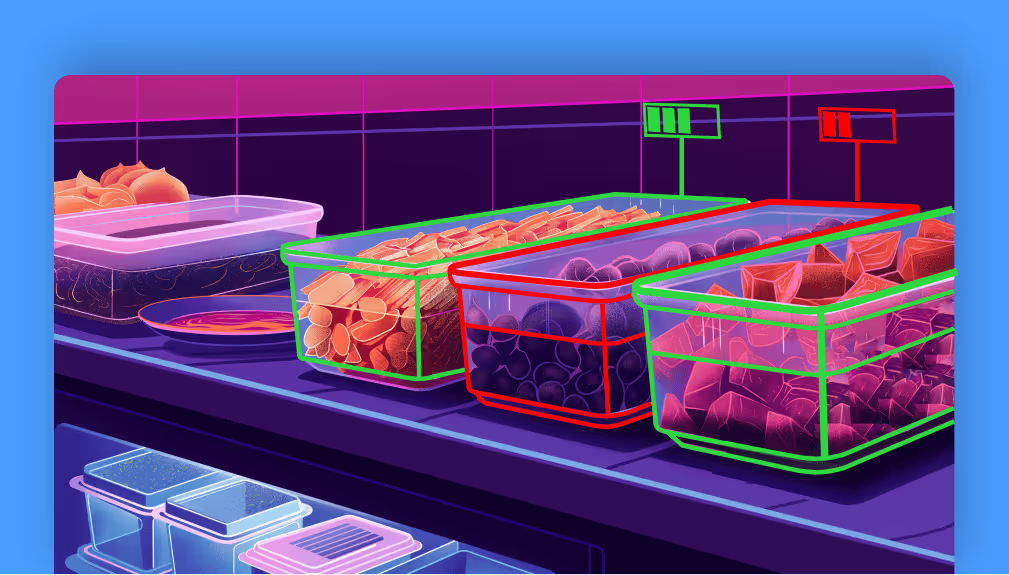
The algorithm analyzed the footage for changes in container status by monitoring protein levels. It color-coded the containers based on the protein levels: red for empty and green for full.
Next, the team structured this data and identified the time intervals between emptying and filling the protein containers. This data was then tied back to the Point of Sale (POS) system data.
Analyzing it revealed insights into the time it took to serve different protein bowls to customers, indicating how fresh or stale the protein was when served.
Digging the results
The team analyzed serving time data for 20, 50, 80, 95, and 99 percent of customers for different bowls. The serving time was found to be much higher than the SOP.
The study questioned the feasibility of the initial 15-minute SOP as it was not followed at the branch picked for analysis.
The team cued further assessments across different branches to see if this was a localized issue.
Regarding the metrics used in the analysis, the team observed a 90-93% precision and a recall of around 95%. This means the algorithm was quite good at accurately detecting relevant cases from the given data.
Note: The team made a consideration along the way. Predicting refills, especially when containers were not really empty, was a challenge. So, the team trained the model to conservatively treat half-empty containers as empty to ensure accurate predictions of refills.
Expanding possibilities
The success of this video analytics use case opens doors for future applications across other outlets and our other clients across industries.
Building a data platform doesn’t have to be hectic. Spending over four months and 20% dev time just to set up your data platform is ridiculous. Make 5X your data partner with faster setups, lower upfront costs, and 0% dev time. Let your data engineering team focus on actioning insights, not building infrastructure ;)
Book a free consultationHere are some next steps you can take:
- Want to see it in action? Request a free demo.
- Want more guidance on using Preset via 5X? Explore our Help Docs.
- Ready to consolidate your data pipeline? Chat with us now.
Related articles


.png)

How retail leaders unlock hidden profits and 10% margins
Retailers are sitting on untapped profit opportunities—through pricing, inventory, and procurement. Find out how to uncover these hidden gains in our free webinar.
Save your spot